Python, Dash & Plotly
After playing with a number of monitoring tools to keep track of the various sites and devices around the house, since none of them did what I envisioned, I decided to try to take a stab at building my own app. I thought about doing it as a mobile app, but realized a web app would be much more versatile. After some searching, I came across Plotly and think it might suite my needs.
This Dash example got me particularly excited:
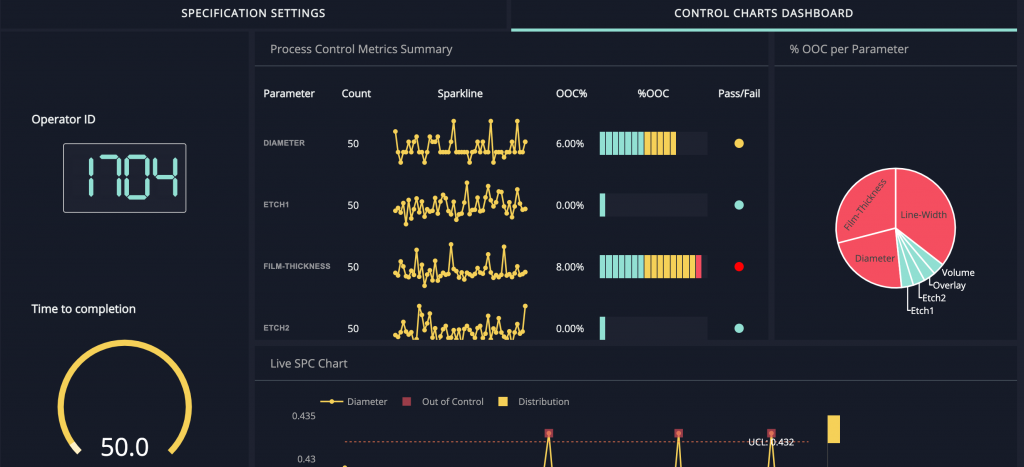
(Initially found here)
I got to work installing Python, Plotly and Dash on a spare Raspberry Pi Zero W I had been using for monitor experiments with Zabbix and Nagios.
I immediately started running into some issues. The code I was trying to run was very basic from Plotly/Dash examples. It would run, and said it was rendering on port 127.0.01:8050 but when I would try to connect remotely (say to 192.168.1.174:8050), the connection would be refused.
Since was running the RPi headless, I couldn’t connect to 127.0.01, so I tried to get the code to run on my MacBook. Now I was getting errors running the same code. After some research, I found our that calling my program “test.py” conflicted with the dash library. Simply renaming the code to test2.py allowed it to work.
It was now rendering on 127.0.0.1:8050, but refusing to connect on the MacBook’s lan address
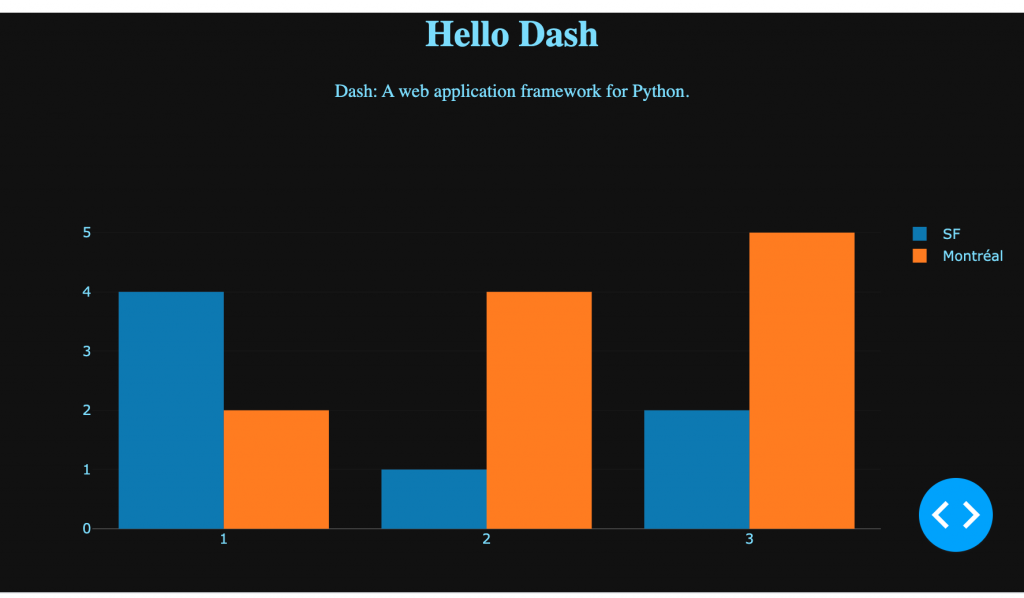
This is where I learned I need to include host = '0.0.0.0'in the “run server()” function in order for the integrated web server to listed on any host. I modified the code on my RPi and now am very happily seeing:
8 March 2021:
I am using a YouTube tutorial from Jay Bhatt to understand some basics of Plotly/Dash.